Technology
A Visual History of the Largest Companies by Market Cap (1999-Today)

A Visual History of the Largest Companies by Market Cap
The macro narrative that underlies the market is constantly under revision.
While this is partially a function of shifts in investor sentiment, it’s also driven by game-changing events as well as much more structural market forces.
For example, how does the macro narrative change after a commodity price crash? What about when the unprecedented scale of technology is truly understood by the market?
An Evolving Narrative
In this week’s chart, we look at how the big picture narrative has changed over time by using a very simple approach.
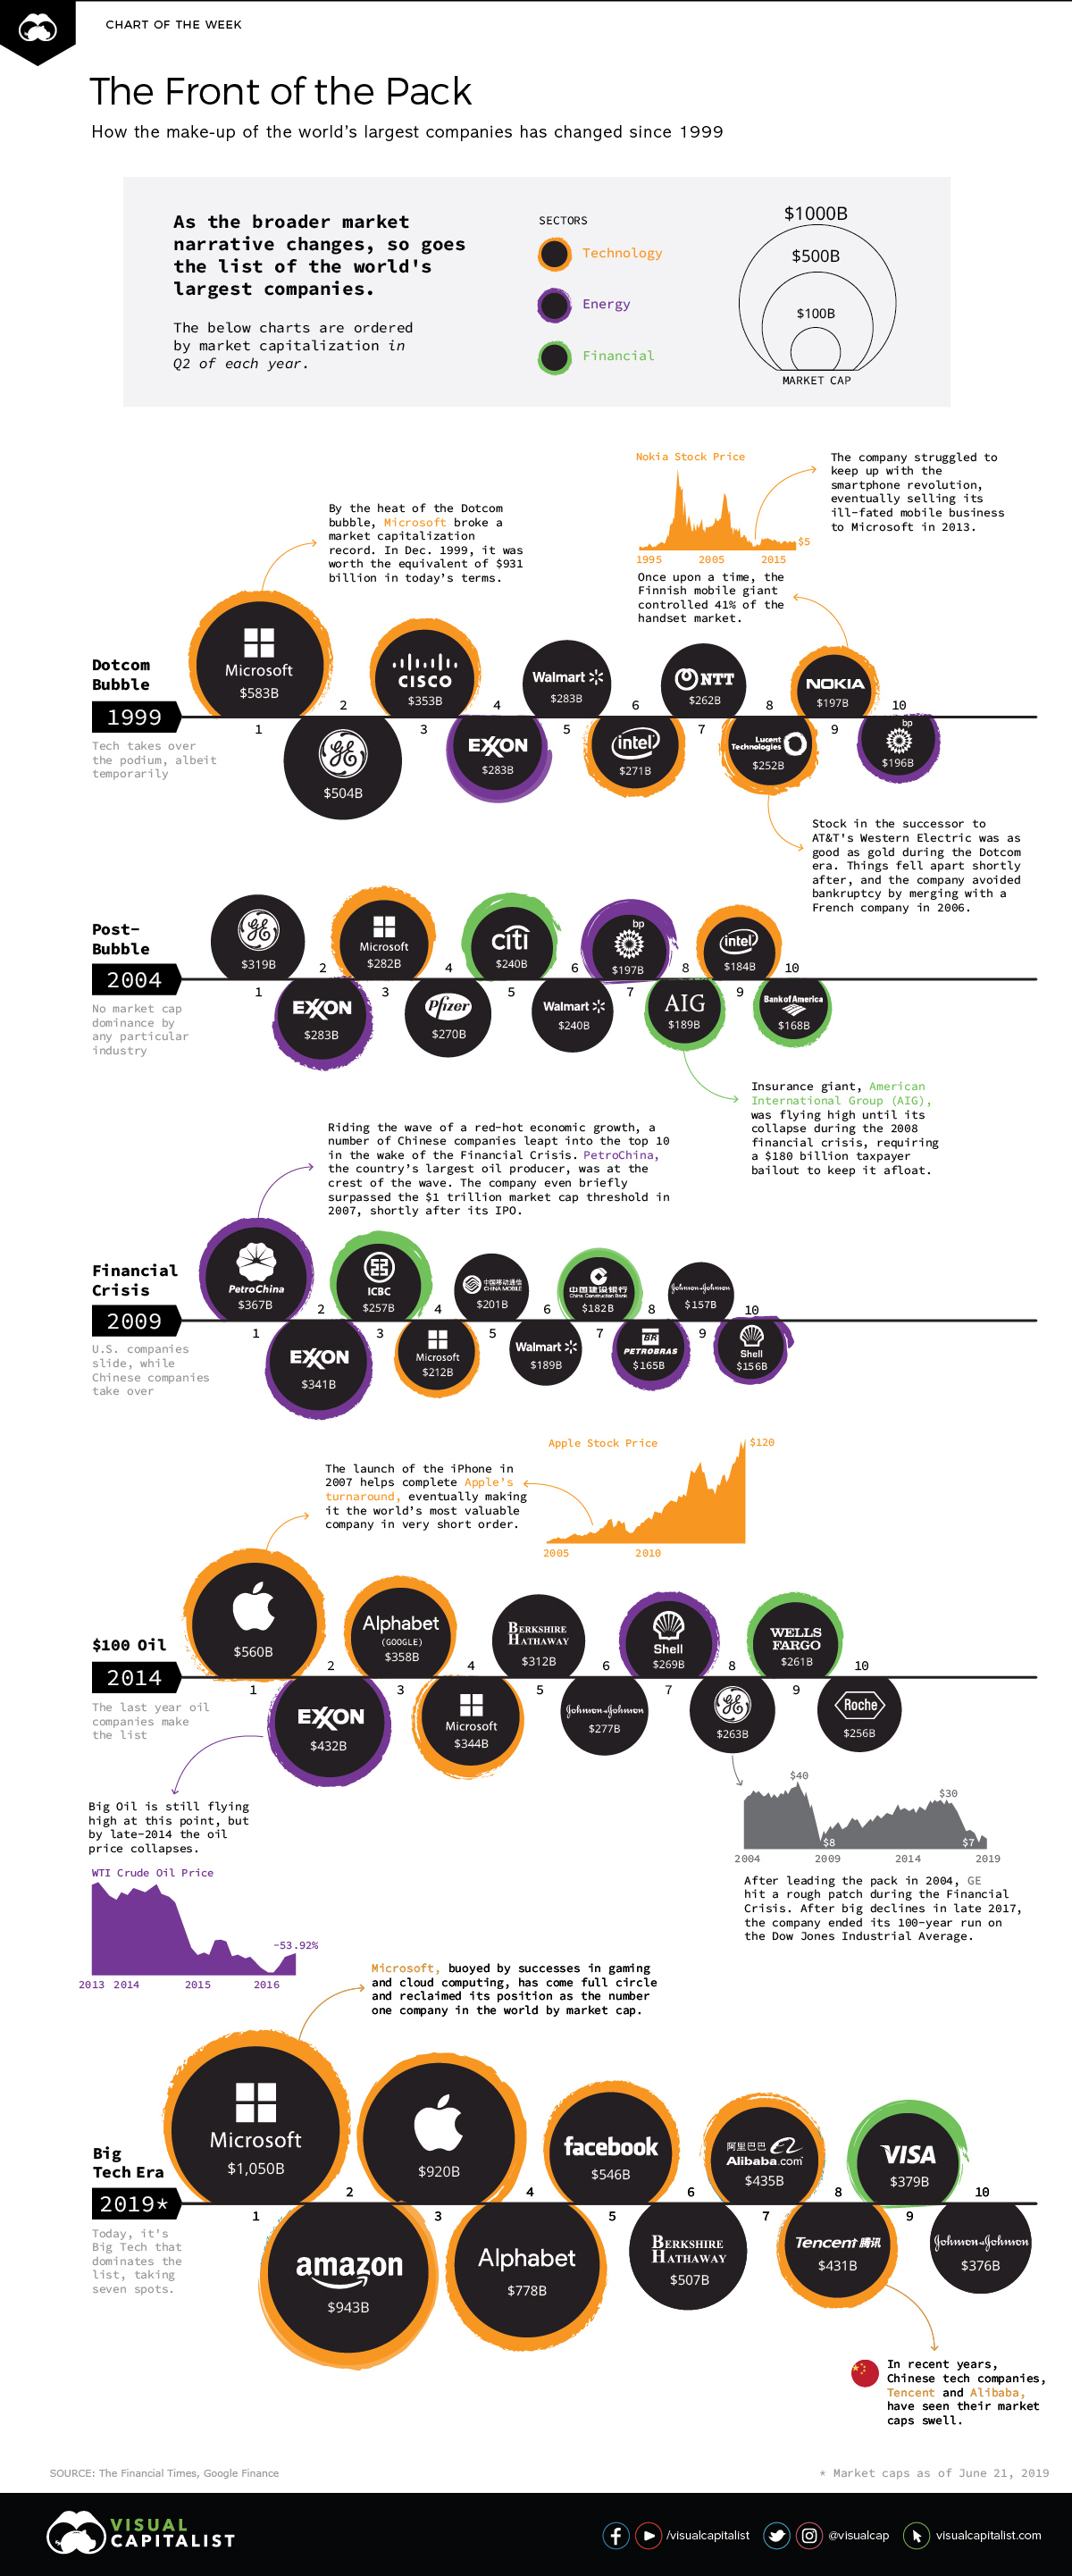
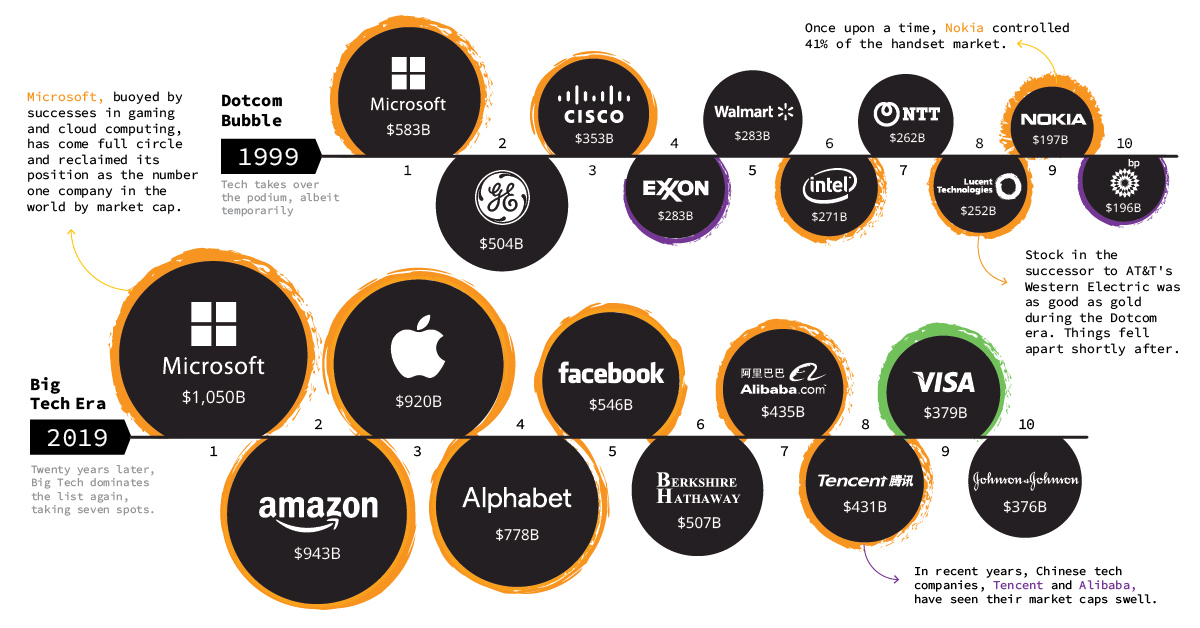
We have visualized the market capitalizations of the 10 largest public companies in the world over five-year intervals from 1999 until today, and it gives us a series of snapshots of what the market was “thinking” during these specific periods.
Not only is it evident as certain industries rise to prominence, but there are also some interesting individual stories to follow. We can see iconic companies – such as Apple – ascend into the public consciousness, while others fall off the radar completely.
| Year | Description | Top Company | Who Dominates Top 10? |
|---|---|---|---|
| 1999 | Dotcom Bubble | Microsoft ($583B) | Five tech companies in the mix |
| 2004 | Post-Bubble | GE ($319B) | Diverse mix of companies by industry |
| 2009 | Financial Crisis | PetroChina ($367B) | Six non-U.S. companies make list |
| 2014 | $100 Oil | Apple ($560B) | Last year for oil companies, tech starts ascending |
| 2019 | Big Tech Era | Microsoft ($1,050B) | Seven companies are tech |
The composition of the top 10 changes in each of the snapshots above, and this simple approach helps capture the market narrative for each timeframe.
During the Dotcom Bubble, you can see that half of the list was dominated by tech companies. This was short-lived, and the years 2004, 2009, and 2014 have much more diverse lists.
You can also see the impact of the financial crisis on U.S. company valuations. In 2009, there is an equal distribution of Chinese and American companies. Royal Dutch Shell (UK/Netherlands) and Petrobras (Brazil) help round out the top 10.
Finally, over the last five years, you can see the impact of lower oil prices and the growing scale of tech. Back in 2014, Exxon Mobil was the second largest company in the world by a solid margin, but today it’s been displaced by companies like Facebook, Amazon, Tencent, and Alibaba.
The Big Tech Era
Here is the current top 10 list of the world’s largest companies by market cap:
| Rank | Company | Industry | Market Cap |
|---|---|---|---|
| #1 | 🇺🇸 Microsoft | Tech | $1,050 billion |
| #2 | 🇺🇸 Amazon | Tech | $943 billion |
| #3 | 🇺🇸 Apple | Tech | $920 billion |
| #4 | 🇺🇸 Alphabet | Tech | $778 billion |
| #5 | Tech | $546 billion | |
| #6 | 🇺🇸 Berkshire Hathaway | Diversified | $507 billion |
| #7 | 🇨🇳 Alibaba | Tech | $435 billion |
| #8 | 🇨🇳 Tencent | Tech | $431 billion |
| #9 | 🇺🇸 Visa | Financial | $379 billion |
| #10 | 🇺🇸 Johnson & Johnson | Consumer Goods | $376 billion |
In total, the five biggest tech giants brought in a combined $801.5 billion in revenue last year, and $139 billion in net income.
The Staying Power of Microsoft
With a valuation today of just over $1 trillion, Microsoft is again the world’s largest company by market capitalization.
In this way, the above lists come full circle, since Microsoft was also the biggest company in 1999.
While the software giant experienced short periods where it did drop out of favor, Microsoft was the only company to make the list in our five snapshots above.
Technology
Charting the Next Generation of Internet
In this graphic, Visual Capitalist has partnered with MSCI to explore the potential of satellite internet as the next generation of internet innovation.

Could Tomorrow’s Internet be Streamed from Space?
In 2023, 2.6 billion people could not access the internet. Today, companies worldwide are looking to innovative technology to ensure more people are online at the speed of today’s technology.
Could satellite internet provide the solution?
In collaboration with MSCI, we embarked on a journey to explore whether tomorrow’s internet could be streamed from space.
Satellite Internet’s Potential Customer Base
Millions of people live in rural communities or mobile homes, and many spend much of their lives at sea or have no fixed abode. So, they cannot access the internet simply because the technology is unavailable.
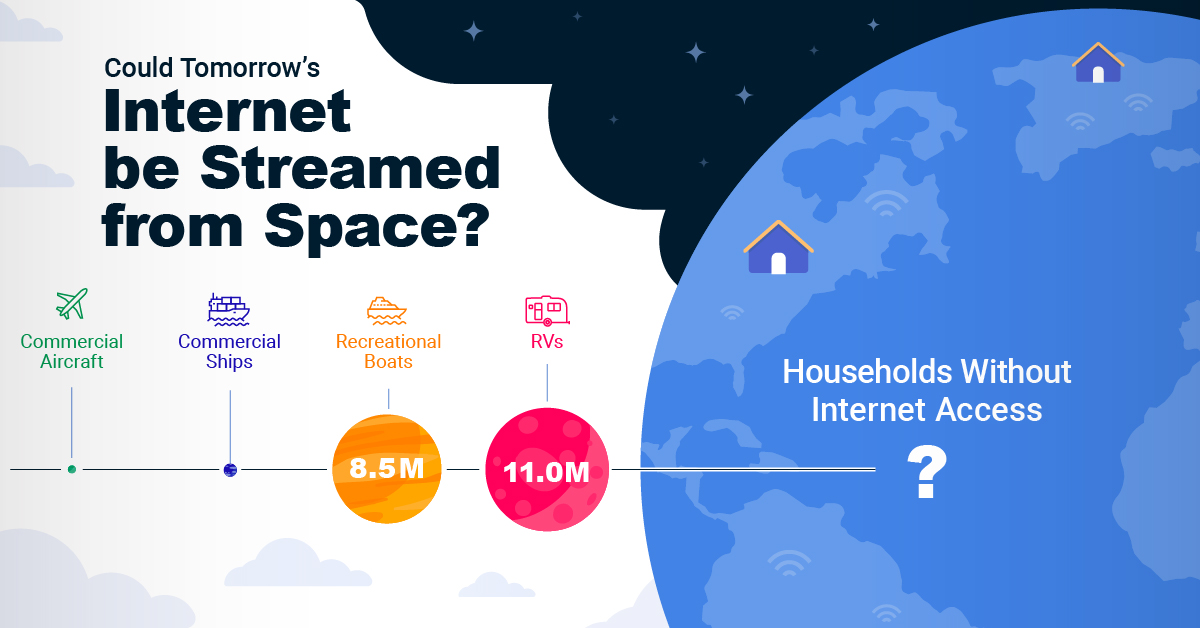
Satellite internet gives these communities access to the internet without requiring a fixed location. Consequently, the volume of people who could get online using satellite internet is significant:
| Area | Potential Subscribers |
|---|---|
| Households Without Internet Access | 600,000,000 |
| RVs | 11,000,000 |
| Recreational Boats | 8,500,000 |
| Ships | 100,000 |
| Commercial Aircraft | 25,000 |
Advances in Satellite Technology
Satellite internet is not a new concept. However, it has only recently been that roadblocks around cost and long turnaround times have been overcome.
NASA’s space shuttle, until it was retired in 2011, was the only reusable means of transporting crew and cargo into orbit. It cost over $1.5 billion and took an average of 252 days to launch and refurbish.
In stark contrast, SpaceX’s Falcon 9 can now launch objects into orbit and maintain them at a fraction of the time and cost, less than 1% of the space shuttle’s cost.
| Average Rocket Turnaround Time | Average Launch/Refurbishment Cost | |
|---|---|---|
| Falcon 9* | 21 days | < $1,000,000 |
| Space Shuttle | 252 days | $1,500,000,000 (approximately) |
Satellites are now deployed 300 miles in low Earth orbit (LEO) rather than 22,000 miles above Earth in Geostationary Orbit (GEO), previously the typical satellite deployment altitude.
What this means for the consumer is that satellite internet streamed from LEO has a latency of 40 ms, which is an optimal internet connection. Especially when compared to the 700 ms stream latency experienced with satellite internet streamed from GEO.
What Would it Take to Build a Satellite Internet?
SpaceX, the private company that operates Starlink, currently has 4,500 satellites. However, the company believes it will require 10 times this number to provide comprehensive satellite internet coverage.
Charting the number of active satellites reveals that, despite the increasing number of active satellites, many more must be launched to create a comprehensive satellite internet.
| Year | Number of Active Satellites |
|---|---|
| 2022 | 6,905 |
| 2021 | 4,800 |
| 2020 | 3,256 |
| 2019 | 2,272 |
| 2018 | 2,027 |
| 2017 | 1,778 |
| 2016 | 1,462 |
| 2015 | 1,364 |
| 2014 | 1,262 |
| 2013 | 1,187 |
Next-Generation Internet Innovation
Innovation is at the heart of the internet’s next generation, and the MSCI Next Generation Innovation Index exposes investors to companies that can take advantage of potentially disruptive technologies like satellite internet.
You can gain exposure to companies advancing access to the internet with four indexes:
- MSCI ACWI IMI Next Generation Internet Innovation Index
- MSCI World IMI Next Generation Internet Innovation 30 Index
- MSCI China All Shares IMI Next Generation Internet Innovation Index
- MSCI China A Onshore IMI Next Generation Internet Innovation Index
MSCI thematic indexes are objective, rules-based, and regularly updated to focus on specific emerging trends that could evolve.

Click here to explore the MSCI thematic indexes

-

 Technology2 weeks ago
Countries With the Highest Rates of Crypto Ownership
While the U.S. is a major market for cryptocurrencies, two countries surpass it in terms of their rates of crypto ownership.
-

 Technology2 weeks ago
Mapped: The Number of AI Startups By Country
Over the past decade, thousands of AI startups have been funded worldwide. See which countries are leading the charge in this map graphic.
-

 Technology3 weeks ago
All of the Grants Given by the U.S. CHIPS Act
Intel, TSMC, and more have received billions in subsidies from the U.S. CHIPS Act in 2024.
-

 Technology3 weeks ago
Visualizing AI Patents by Country
See which countries have been granted the most AI patents each year, from 2012 to 2022.
-

 Technology4 weeks ago
How Tech Logos Have Evolved Over Time
From complete overhauls to more subtle tweaks, these tech logos have had quite a journey. Featuring: Google, Apple, and more.
-

 AI1 month ago
Ranked: Semiconductor Companies by Industry Revenue Share
Nvidia is coming for Intel’s crown. Samsung is losing ground. AI is transforming the space. We break down revenue for semiconductor companies.
-

 Personal Finance1 week ago
Visualizing the Tax Burden of Every U.S. State
-

 Misc7 days ago
Visualized: Aircraft Carriers by Country
-

 Culture7 days ago
How Popular Snack Brand Logos Have Changed
-

 Mining1 week ago
Visualizing Copper Production by Country in 2023
-

 Misc1 week ago
Charted: How Americans Feel About Federal Government Agencies
-

 Healthcare1 week ago
Which Countries Have the Highest Infant Mortality Rates?
-

 Demographics1 week ago
Mapped: U.S. Immigrants by Region
-

 Maps1 week ago
Mapped: Southeast Asia’s GDP Per Capita, by Country


